DE
 EN
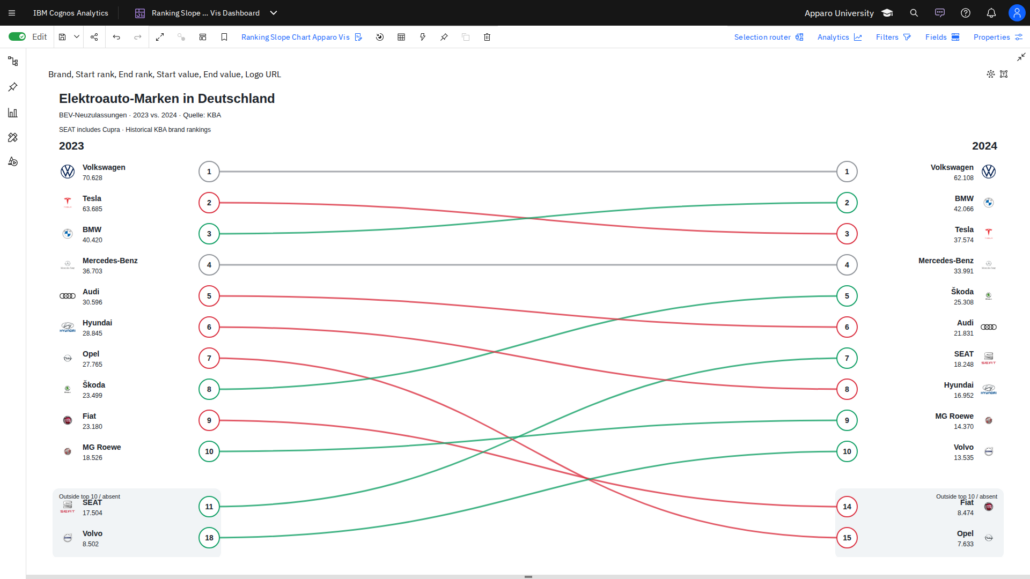
Timelines help users understand activity start dates, durations and overlaps more quickly than a standard list.
Practical approach
Explore whether standard chart types or a custom visualization can represent task intervals and milestones in the required Cognos release.
Validation and limitations
Check tooltips, date scaling, sorting, filtering and how overlapping tasks appear on small screens.
AI-assisted translation and adaptation.