 DE
 EN
 IBM Cognos
Tip
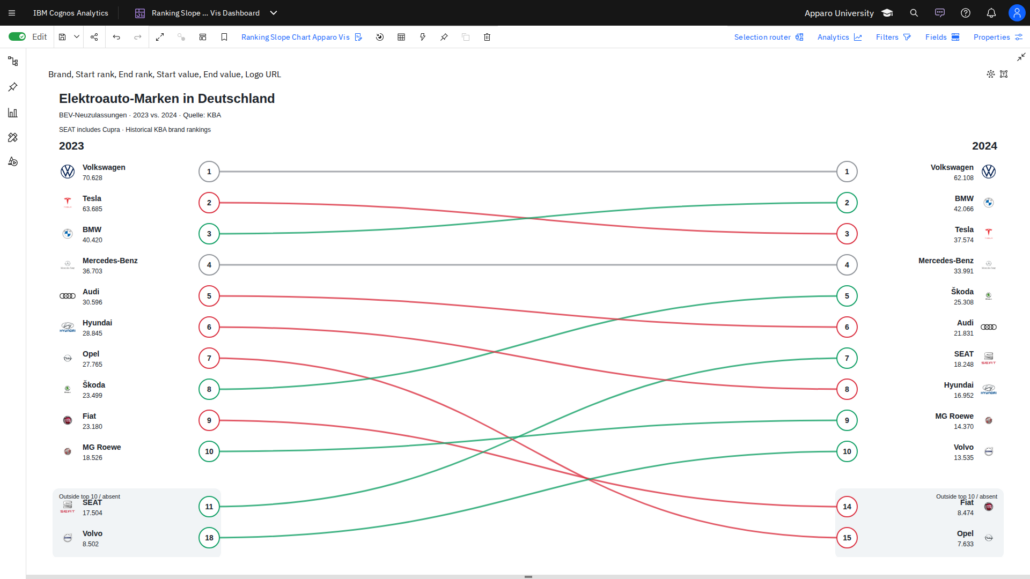
Visual of the Week: Ranking Slope Chart – See Ranking Changes at a Glance
Who’s moving up, who’s falling behind, and how have rankings changed over time? Our Ranking Slope Chart Apparo Vis for IBM …
IBM CognosWho’s moving up, who’s falling behind, and how have rankings changed over time? Our Ranking Slope Chart Apparo Vis for IBM …
 IBM Cognos
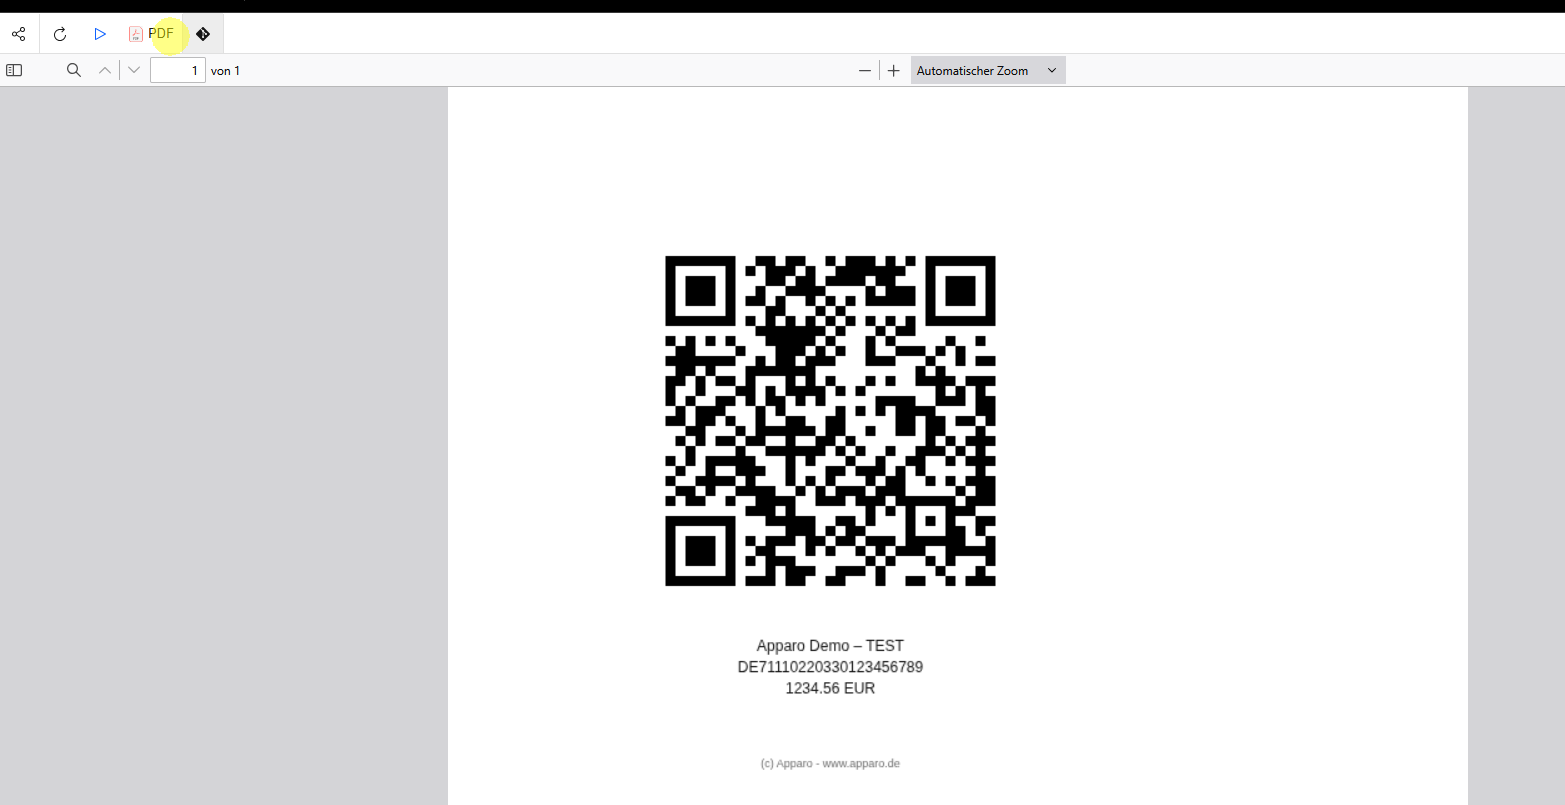
A QR code can connect a printed report with a website, carry payment information or identify a product. QR Code Apparo …
 IBM Cognos
Combining several fact tables can create unexpected duplication or missing totals when join paths are ambiguous.
 IBM Cognos
Timelines help users understand activity start dates, durations and overlaps more quickly than a standard list.
 IBM Cognos
Complex reports often evolve through cycles of query changes, layout adjustments and testing.
 IBM Cognos
Forecasting visualizations estimate future values from historical series, but their output depends on the available data.
 IBM Cognos
Older Cognos Analytics environments could depend on separately configured supporting services for notebooks or image output.
 IBM Cognos
Schematic visualizations can represent a KPI using a gauge, thermometer, arrow or other recognizable business symbol.
 IBM Cognos
Standard charts do not always match the visual language of a particular business process.
 IBM Cognos
Measures such as year-to-date, previous year and rolling periods are easier to maintain when their calendar rules are modeled centrally.
Dataset refresh changes the underlying analytical snapshot but may not immediately affect every open visualization.