DE
 EN
Who’s moving up, who’s falling behind, and how have rankings changed over time?
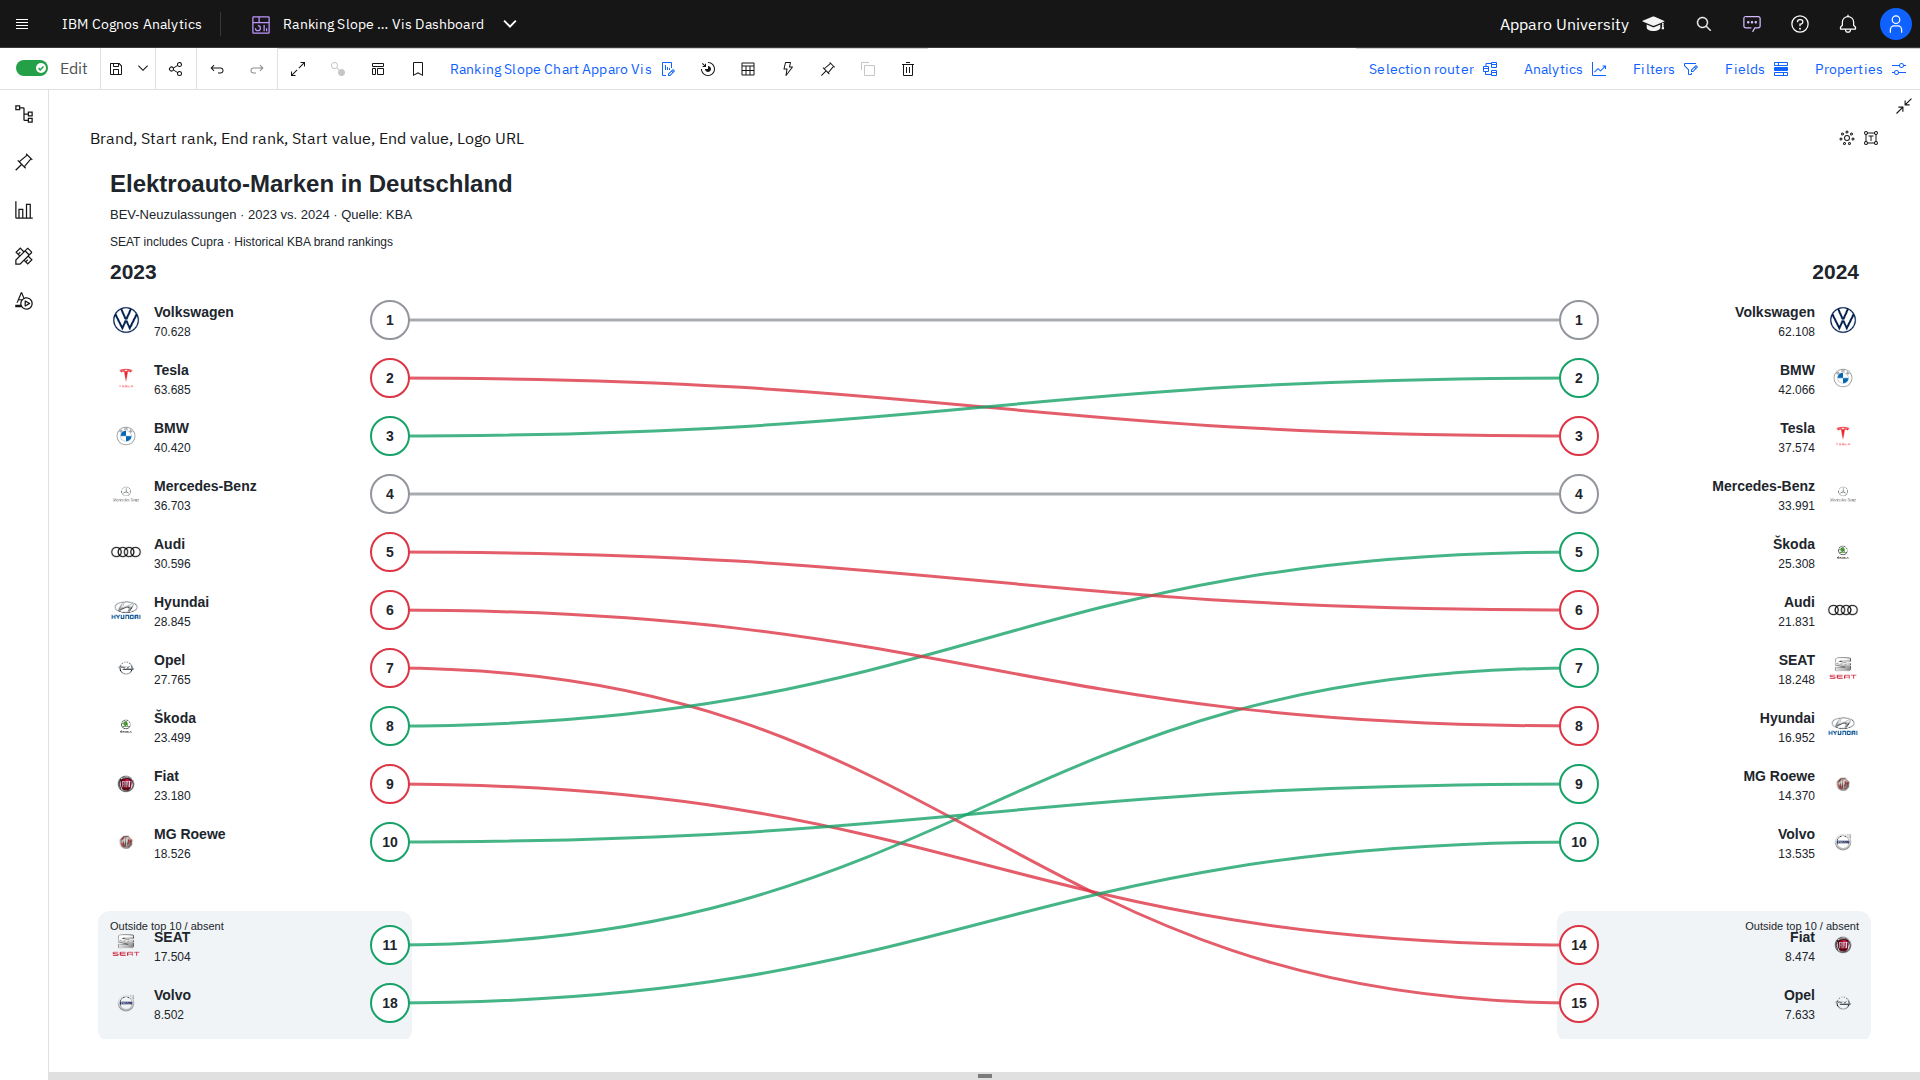
Our Ranking Slope Chart Apparo Vis for IBM Cognos Analytics makes it easy to visualize ranking changes between two points in time.
By connecting category positions with lines, the visualization instantly highlights winners, losers, and stable rankings.
Key Features:
- Ranking Comparison: Clearly visualize changes between two points in time.
- Identify Winners and Losers: Easily spot upward and downward movements.
- Logos and Images: Enhance categories with custom logos or images.
- Interactive Analysis: Explore ranking changes directly within Cognos Dashboards.
- Ideal For: Market shares, product rankings, sales performance, and competitive analysis.
Our example illustrates changes in the rankings of best-selling electric vehicles, complete with manufacturer logos.
Explore more custom visualizations for IBM Cognos Analytics in our continuously growing Visual Library.