DE
DE EN
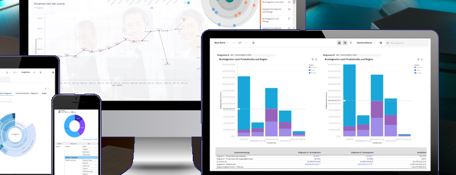
ENStandard charts do not always match the visual language of a particular business process.
Practical approach
Custom schematics can encode operational states using illustrations or specialized indicators in a Cognos dashboard.
Validation and limitations
Document data mappings, asset packaging and supported APIs, then test keyboard access, responsiveness and exported output.
AI-assisted translation and adaptation.