 DE
 EN
 IBM Cognos
Tip
Enable Custom Visualization Output in PDFs
A custom chart that works in the browser may still fail to appear in a rendered PDF.
IBM CognosA custom chart that works in the browser may still fail to appear in a rendered PDF.
 IBM Cognos
Schematic visualizations can represent a KPI using a gauge, thermometer, arrow or other recognizable business symbol.
 IBM Cognos
Standard charts do not always match the visual language of a particular business process.
 IBM Cognos
Scheduled report distribution can disclose data if recipients are not controlled.
 IBM Cognos
The same business filter may behave differently depending on where it is applied in the reporting query.
 IBM Cognos
Measures such as year-to-date, previous year and rolling periods are easier to maintain when their calendar rules are modeled centrally.
 IBM Cognos
Dense management reports sometimes require several KPIs in the same crosstab intersection.
 IBM Cognos
A single search prompt can be more flexible when users need to find several terms at once.
 IBM Cognos
A box plot communicates median, spread and outliers, but the exact visualization may not be available in every report scenario.
 IBM Cognos
Custom visualizations add flexibility but also introduce maintenance and version compatibility responsibilities.
 IBM Cognos
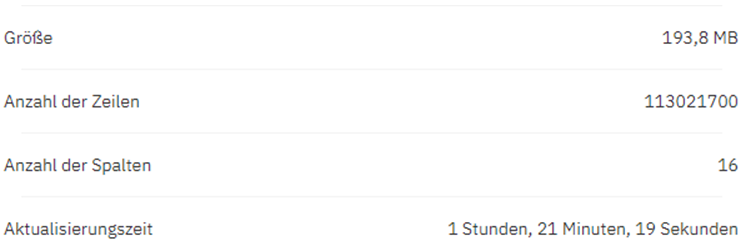
Large datasets can accelerate repeated analysis, but row counts alone do not determine their usefulness.
Alphabetical sorting is wrong for many chronological categories: April may appear before January.